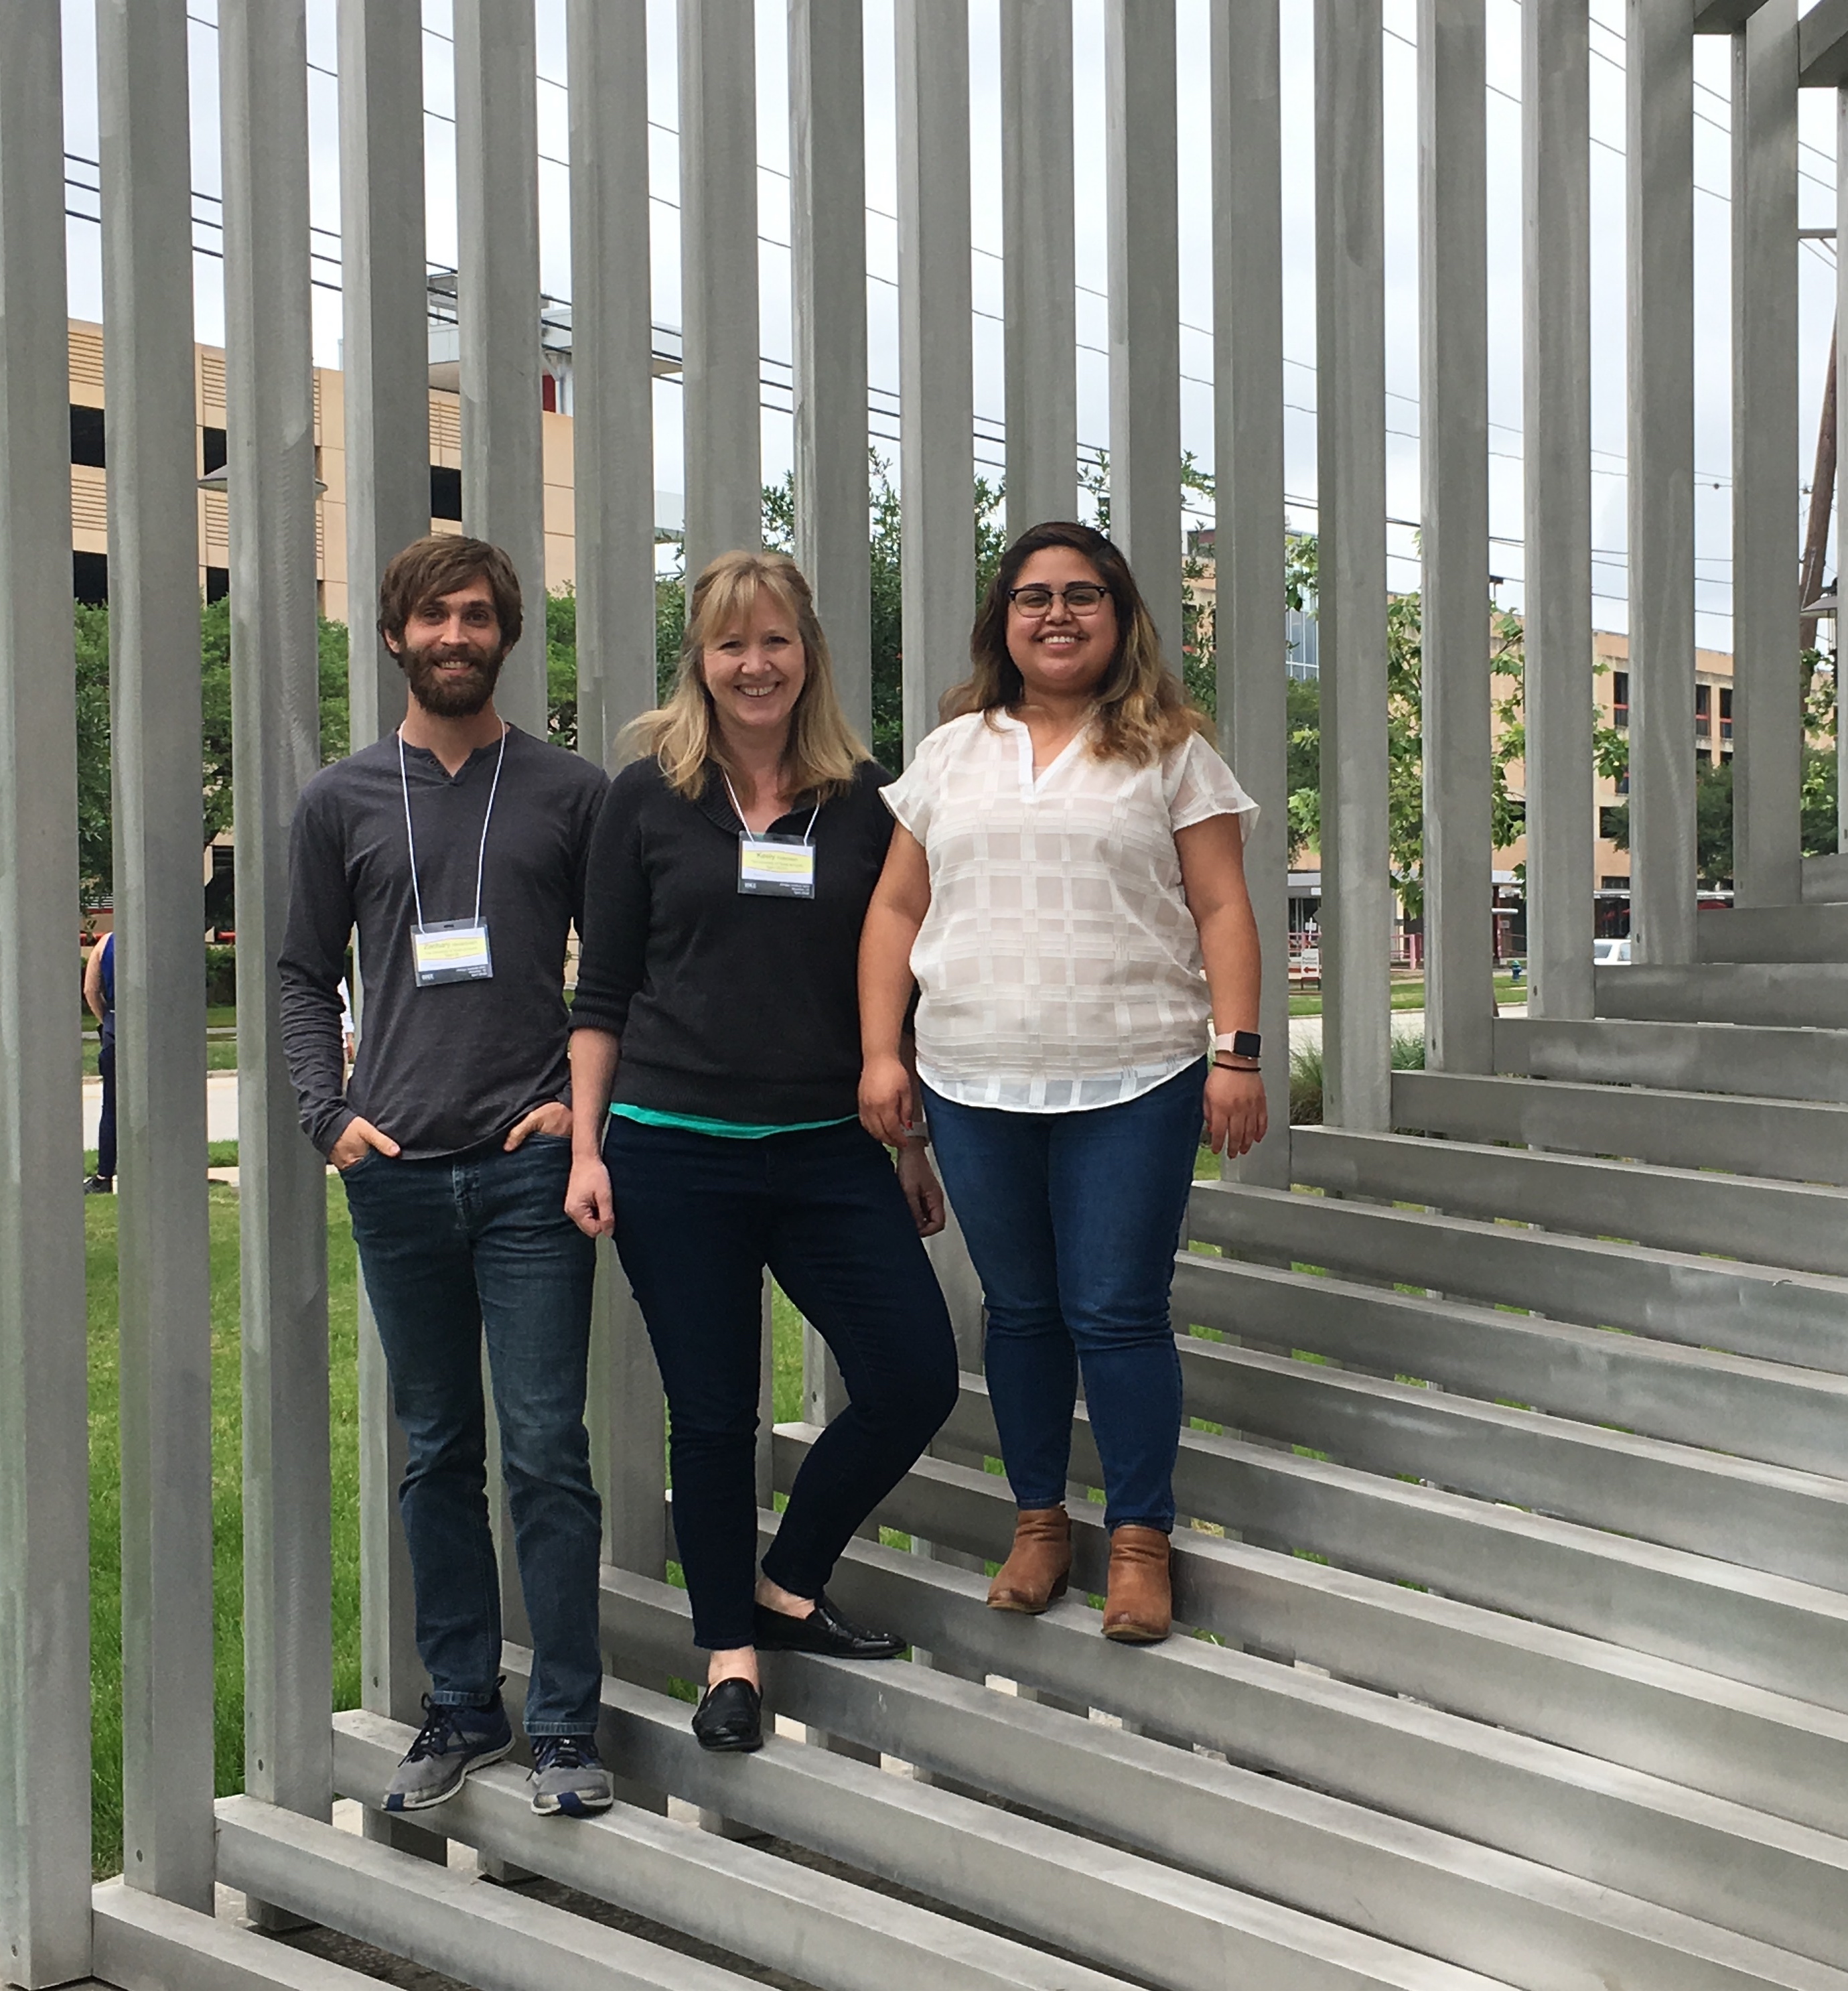
UT Austin Research Methods course: this team of scientist/engineer educators designed and taught an inquiry lab activity through ISEE’s Professional Development Program
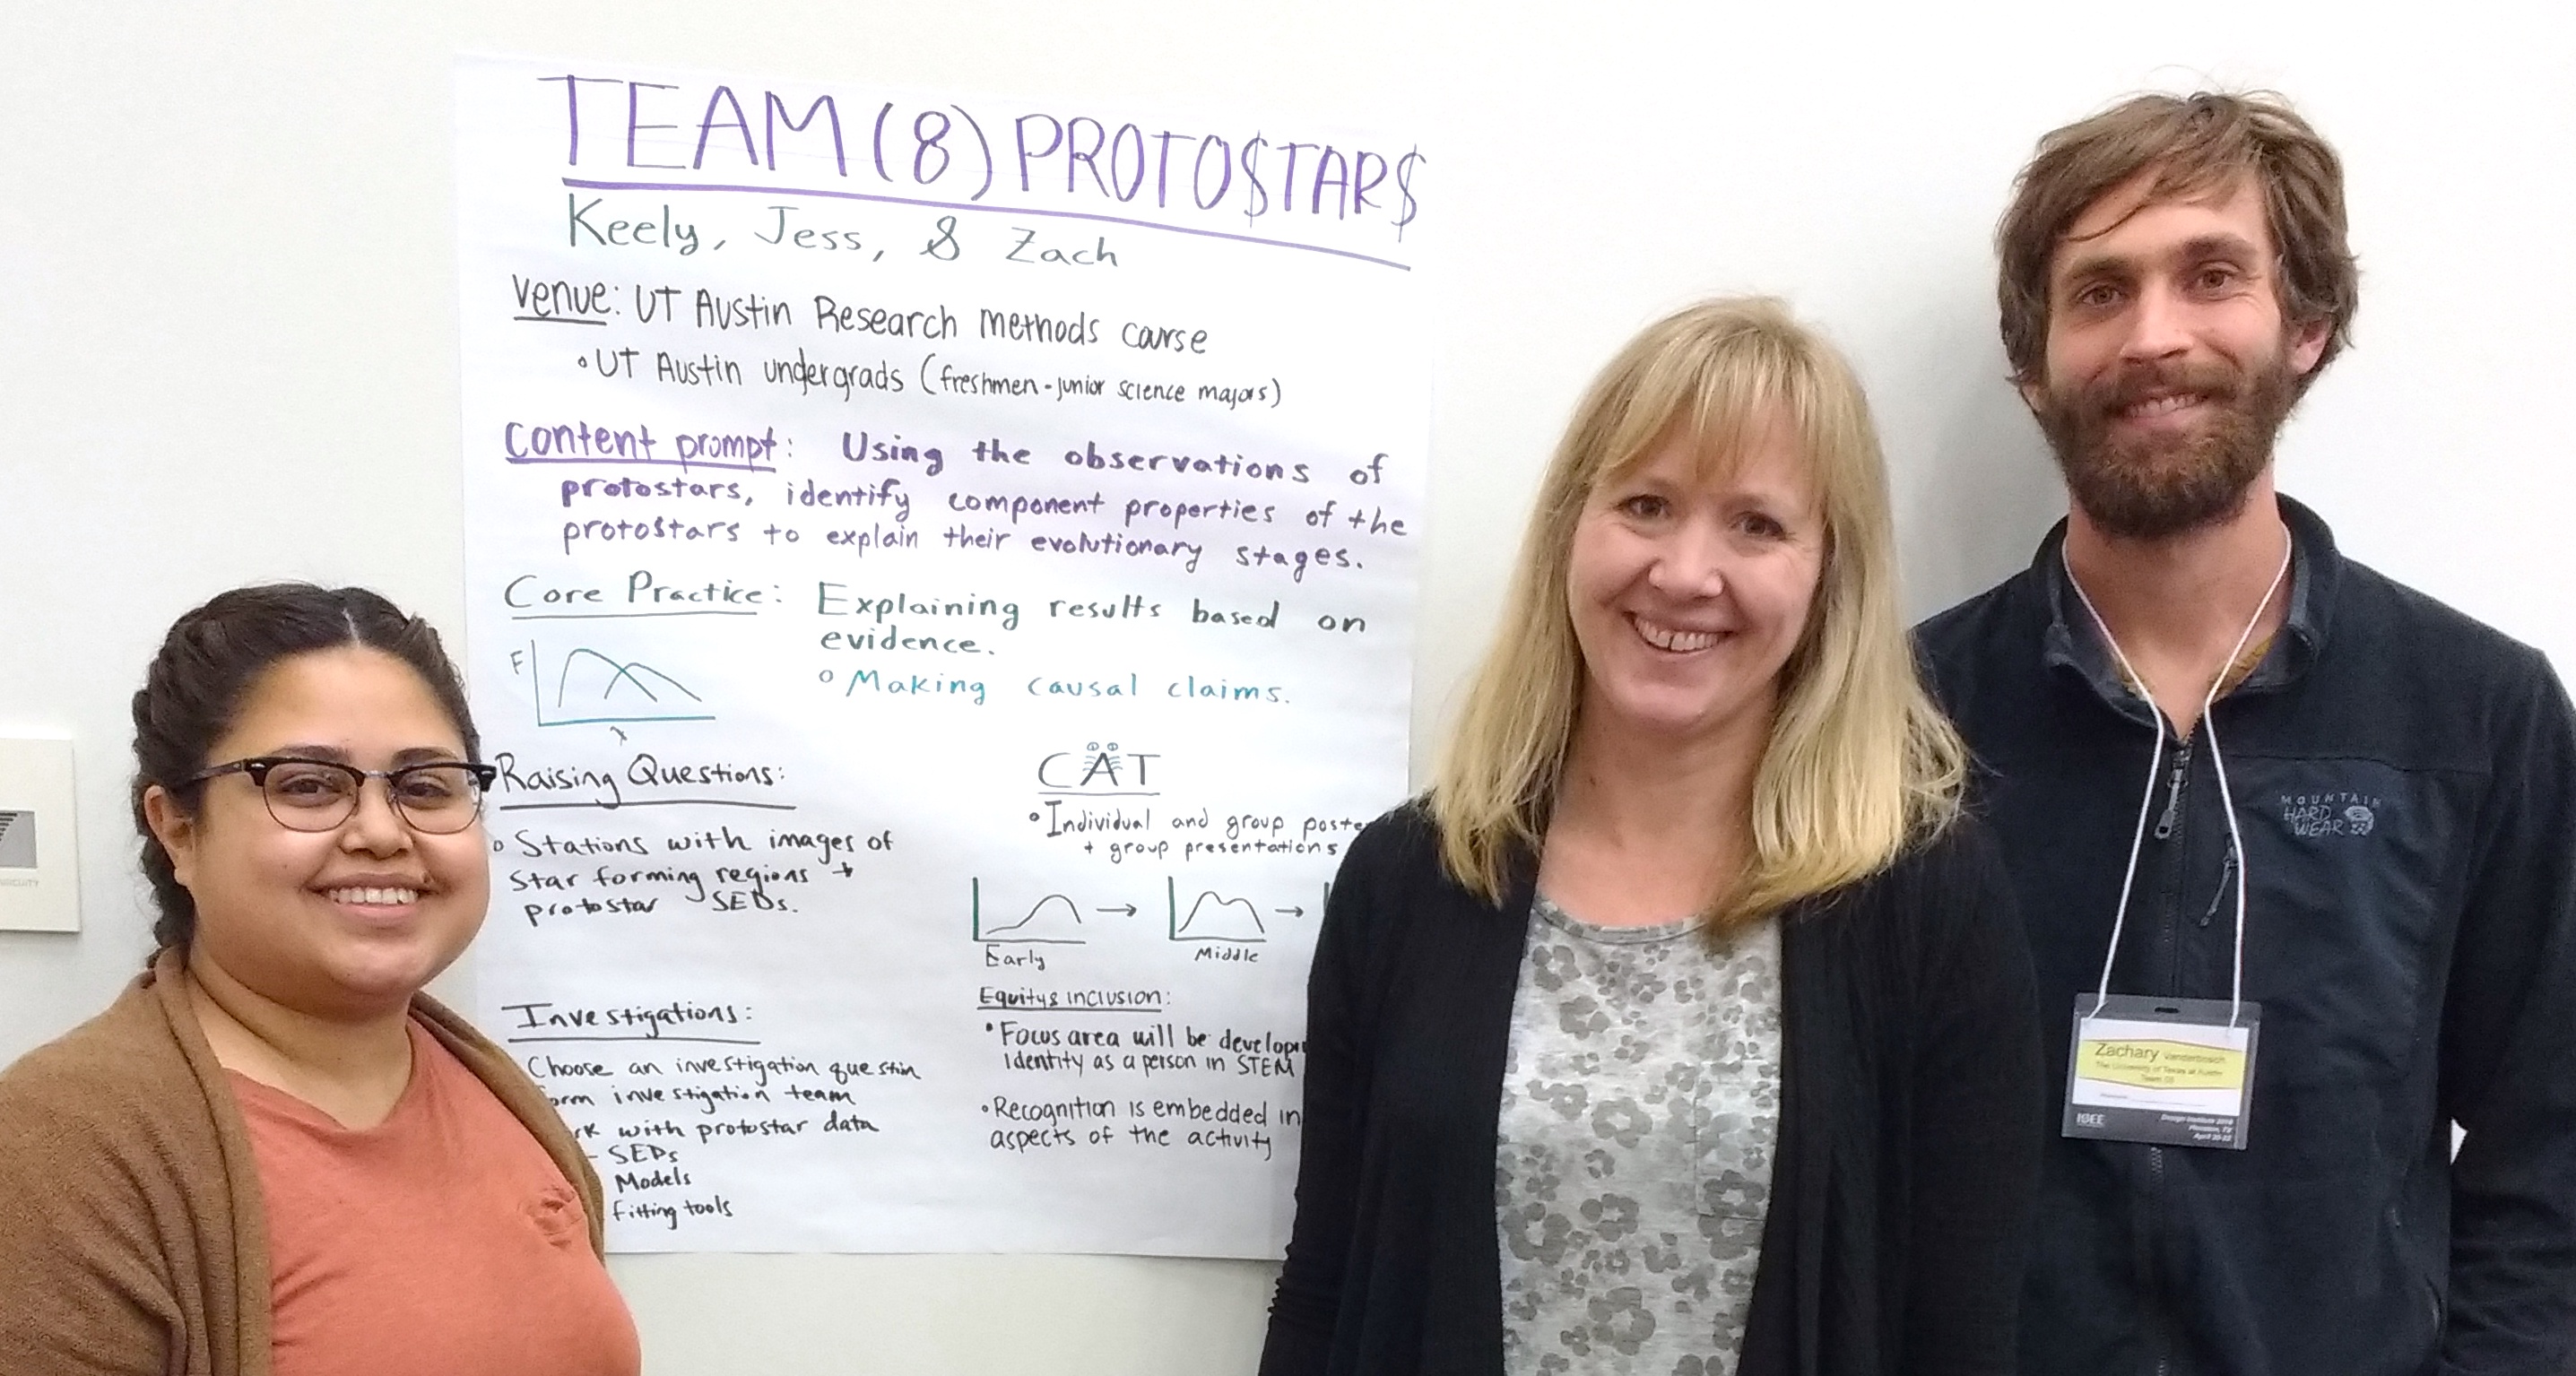 L-R: Jessica Luna, Keely Finkelstein, Zachary Vanderbosch
Venue: UT Austin Research Methods course
Team Members:
Keely Finkelstein (Design Team Leader): Research Assoc. Lecturer, Astronomy, University of Texas at Austin
Jessica Luna: Graduate Student, Astronomy, University of Texas at Austin
Zachary Vanderbosch: Graduate Student, Astronomy, University of Texas at Austin
Audience: 20 first and second year undergradute students
Activity Name: Protostars
Learning Goals (Author Keely Finkelstein):
Our main content goal was for students to use observations of protostars to interpret the shape of the
spectral energy distribution of individual protostars in order to identify components of a protostar, its
evolutionary stage, and the statistical significance of the results. The most challenging parts of the core
concept most often came from the extension pieces of the learning outcome including making a connection
and identify evolutionary stage. Students were mostly successful at the first parts of using observations,
fitting spectral energy distributions to the data, and interpreting the results. The challenge came in making
the next step or connection to what those results meant about evolutionary stage. Our content rubric did
allow us to asses both of these components.
Our activity was designed that students were given an SED fitting tool that used a simple blackbody SED
model, but allowed students to modify the parameters of the SED to best fit to their observed data, including
temperature and strength which can be used as a proxy for mass or luminosity. The tool also allowed them
to fit a two-component SED so that they could explore if their sources had multiple physical components.
Within the context of the activity, the learners in teams had the freedom to choose which datasets to work
with and had to come up with their own investigation question related to protostars and the data they were
introduced to.
The content rubric consisted of three dimensions related to properties of protostars: 1) Describe basic
properties of protostars. 2) Identify features within the SED. 3) Compare protostellar evolutionary stages. At
the end of the activity, individually students were given a plot of a new protostar with a model SED best-fit to
the given example protostar. They were prompted to Label any important features on the SED and relate
them to an expected physical structure or component you might see in the protostar. They were also asked
to draw a cartoon version of what they think the protostar might look like. Finally, they were then asked to
compare their individual given protostar and plot to their partner(s) example(s) in their CATs and make note
of any differences or similarities in the physical nature of the protostars.
We collected and assessed the individual CATs using the Content Rubric. There were three dimensions, and
each dimension was scored from 0 to 1, giving a maximum point total from this rubric of 3 points. In rubric
dimensions 1 and 2, 17 out of 20 students scored 2 total points (the maximum), meaning those 17 students
showed evidence of sufficient understanding in both of these first two dimensions. Only three of the 20
students, struggled with one or both of the first two dimensions. For the third dimension, 8 out of 20
students received 1 point in this dimension, showing evidence for sufficient understanding in this area. The
other 12 students struggled more with this dimension and therefore scored a 0 in this part of the rubric, and
either had an incomplete understanding or was missing information to make a judgement. For dimension 3,
we did find that more students struggled with this, or just did not provide any evidence related to this
component. Therefore, in the future if doing this activity again, it would be beneficial to either provide more
investigation time to ensure learners get to this step in the investigation, and also provide additional tools to
allow them to develop investigation questions a little more rigorously that will allow them to explore this
aspect. For example, giving them more data related to the regions themselves and individual protostars,
such as exact coordinates / locations within the region in order to make comparisons between the images
and the protostar data.
Funding for this team was provided by: Sponsor: National Science Foundation (AST#1643290)